

Using infographics is a tried-and-true link-building method. We’ve been using infographics to build links for years, and it has proven to be a magnet for high-quality backlinks.
If done correctly, infographics can be a quality asset that helps you drive more organic traffic to your website, improve your search engine rankings, and increase brand awareness online.
However, creating an infographic for the purpose of link-building isn’t as simple as designing an aesthetically pleasing piece of content. There’s more to getting this right than you may think.
In this article, we unpack the steps to create infographics that drive real results and some outreach tips to maximize your efforts.
Keep reading to discover:
➡️ What infographics are and their different types.
➡️ The benefits of using infographics for building links.
➡️ How to develop infographics.
➡️ Top outreach techniques to get links to your infographic.
What Is Infographic Link Building?
An infographic is a type of content that displays information in a graphic format:
💡 Info: Information.
💡 Graphic: A graphic or designed image.
Infographics are a visual representation of data typically presented in a digestible, colorful format so that it can be read and understood easily.
Infographic link-building is a tactic that involves creating an infographic and using it to attract backlinks.
Marketers and search engine optimization (SEO) professionals can use infographics as a part of their link-building strategy or as a single campaign. Either way, infographic promotion is a great way to get some much-needed links.
What are the benefits of infographic link-building?
Some benefits of using infographics as a part of your marketing or SEO strategy include:
✅ Boosted search rankings: The very nature of infographics makes them more likely to be linked to. Just one link signals to search engines like Google that your website is a trustworthy source of information.
✅ Improved website metrics: Infographics are highly engaging and can help increase the time people spend on your website.
✅ Increased website traffic: Because infographics are so sharable, they can appear on various websites and social media platforms—all of which create backlinks to your website. This can result in additional visitors and even more conversions.
✅ A cost-effective link-building solution: Link-building can be expensive, especially because you need to create content to link to. Infographics are relatively affordable to create, and the return on investment (ROI) can be exponential if it results in brand awareness, traffic, and a better position in search rankings.
✅ Better engagement: If an infographic is compelling enough, it will keep visitors on your website for longer and may even see them return for more. This gives you a greater chance of converting your visitors into paying customers.
✅ Enhanced authority and brand awareness: Infographics can help present your brand as an authority and thought leader in your industry. This makes people more likely to trust and engage with your brand.
✅ Sharing your brand message: As infographics are so sharable, the more they are shared, the further your brand messaging spreads.
What are the different types of infographics?
There are several types of infographics out there, and you may want to explore these categories before creating your own infographics.
Each type of infographic has its own purpose, and its design will need to be tailored to suit your content.
Here are some different formats for infographics.
Timeline infographics
This infographic displays a sequence of milestones, achievements, or events in a particular order—usually chronologically.
Timeline infographics explain the history or evolution of something like a historical event or a company’s growth.
Statistical infographics
These infographics are used to depict data and statistics, which can be used to enrich your overall content and drive your argument home.
Statistical infographics include charts, graphs, and other types of visual data.
The purpose of such infographics is to simplify complex information for the reader.
Comparison infographics
Comparison infographics are used to compare two or more things against each other.
They could compare services, prices, trends, and pros and cons.
Usually, comparison infographics include graphs or side-by-side comparisons to help the reader understand the differences between what is being compared.
Process infographics
Often, companies have complicated processes that they need to explain in a way that is easy for their employees to grasp. This is the perfect example of when process infographics are useful.
These infographics typically include flowcharts, pathways, and diagrams that help the reader move from one point to the next through the whole process.
Geographic infographics
Much like a visual map, geographic infographics display geographic data to highlight specific patterns or details in a location or area.
Hierarchical infographics
This type of infographic—also known as geo infographics—uses hierarchical design elements to display a top-down structure such as a company leadership structure, processes, or relationships.
List infographics
This final type of infographic is one of the most popular kinds you’ll find online. List infographics present information in a list format with visual additions that make the data easier to follow and interpret.
Is Infographic Link Building Difficult?
Now that it’s widely known that infographics are a great way to build links, more people have started using this strategy.
Additionally, brands are upping their game when creating visually appealing content. So, to stand out above the rest is tricky.
We believe that, as a result, the quality of the infographics being produced these days is difficult to compete with.
However, by following the steps outlined in this article to create your own infographics for link-building purposes, you should achieve success in this competitive field.
The Basics of a Compelling Infographic
Before we get started on the exact steps you need to follow to create infographics for link building, let’s look at some of the most important aspects of what makes a good piece of visual content.
To design a compelling infographic, you need to:
👉 Start with a strategy: Link building without a strategy isn’t going to get you far. You need to have an infographic link-building strategy in place before you even attempt to develop an infographic. Your strategy should include details like your link-building campaign and outreach techniques.
👉 Prioritize quality over everything: If you want to give website owners a good reason to link to your infographic, it needs to be of high quality. Prioritize creating quality content rather than large batches of low-quality work.
👉 Have a beautiful and thoughtful design: A generic Canva template that’s being used by thousands just won’t cut it. You need to invest in the right designer who can really bring visual elements to life.
👉 Find (and stick to) a compelling topic: Take time to research what’s trending or what people are discussing right now. Choose a topic that is relevant to your industry, too. You must stick to one topic throughout your infographic to keep it focused, and easy to follow.
👉 Do in-depth research to stand out: Your infographic content must be worth reading. Ensure that you spend time on thorough research around the topic and gathering the latest and most relevant information. If you want your infographic to help you build authority, your content needs to be factually correct, current, and relevant.
A Step-By-Step Guide for Building Links with Infographics
Whether you’re an agency, brand, or individual, you can use these steps to build links using infographics.
For the purpose of this article, we’re going to use the example of a client that sells wedding planning services.
Step 1: Find a concept
The first thing you need to do is decide what your infographic is going to be about and the type of design you want to go with.
A good place to start is to visit visual.ly/tag/wedding (change the last part of the URL to your niche) and filter to find the most favorite infographics for that tag.
Infographic directories like Visual.ly can help you develop a better infographic, as you’ll get a good idea of what works.
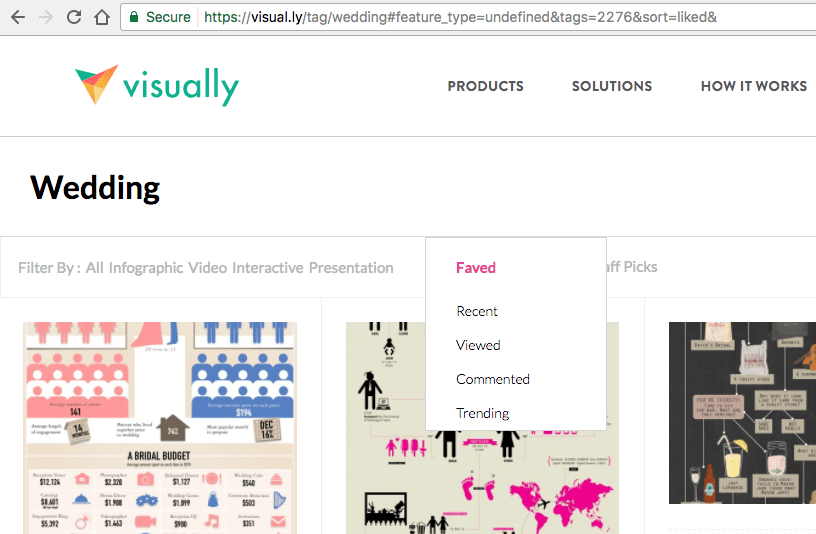
Take your time browsing through these existing infographics and make notes about what you think will work for you.
Using this tool can help you find a topic that is relevant to your niche and highly sharable.
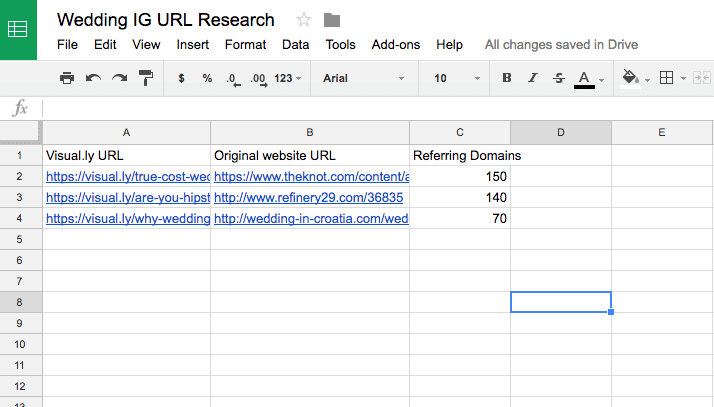
Now, make a list of the Visual.ly URLs for each infographic. You should also find the source of the infographic—the original page on the website that created it—and also take note of this.
You can use Google image search to find popular infographics.
You should start building a list that looks like this:
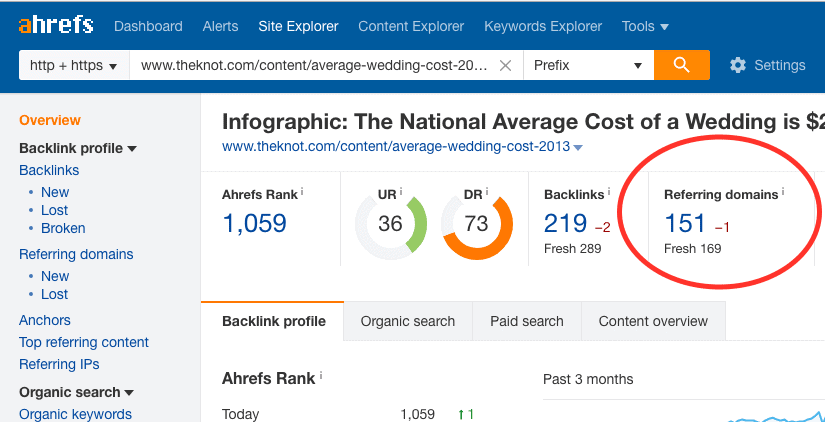
Next, you can use an SEO tool called Ahrefs to find infographics that are already highly successful.
In our wedding planning example, you would go into Ahrefs and type in ‘wedding infographic’.
Of course, you would change this term for one relevant to your niche.
Then filter by ‘referring domains’ and choose four to five infographics you can see have successfully attracted many links.
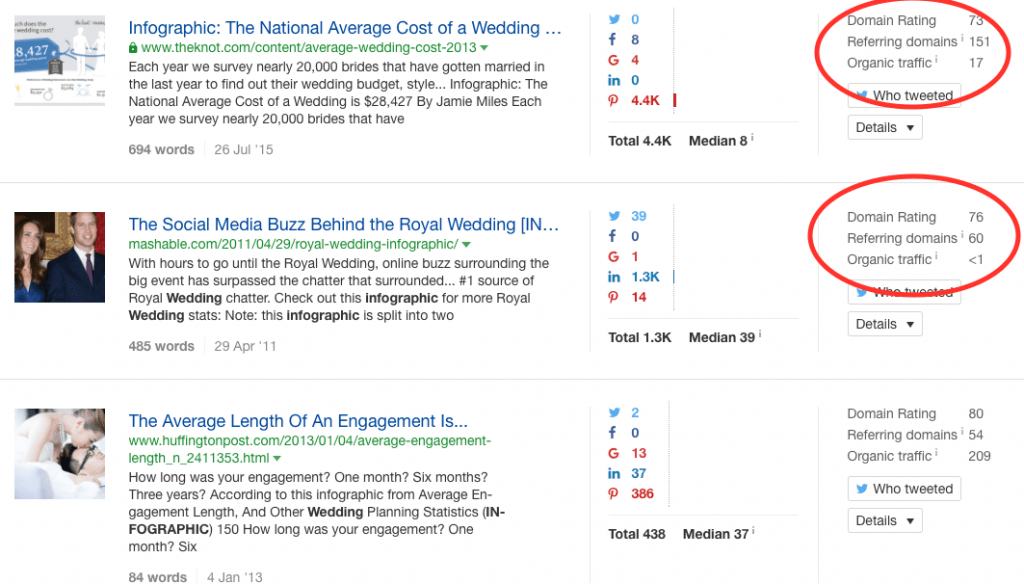
Now, add all of these to your master list of URLs.
Lastly, you need to settle on your concept and your title.
Our advice would be to brainstorm a few ideas by taking the best parts from your list of successful infographics.
When creating infographics for link building, we tend to combine two or three ideas and merge them into one superpowerful infographic.
Step 2: Research your data
Now that you have your infographic title and concept ready, you need to list all the relevant data points and information you want included in your link-building infographic.
This needs to be done before handing it over to a designer.
Some infographic services will do the research for you, but we’ve had far greater success doing it ourselves, as third-party services can sometimes cut corners in the research process.
There are two main ways for you to find your data points:
💡 Use data from existing infographics. But be careful not to plagiarize—you want an entirely original infographic.
💡 Find your own data sources using Google search. Simply type in your keyword followed by ‘data’ or ‘trends’ or ‘statistics,’ and you should have some nice results that you can pull into your infographic brief.
You should now have a brief ready to hand over to your infographic designer-–which we’ll get to in a moment—that looks something like this:
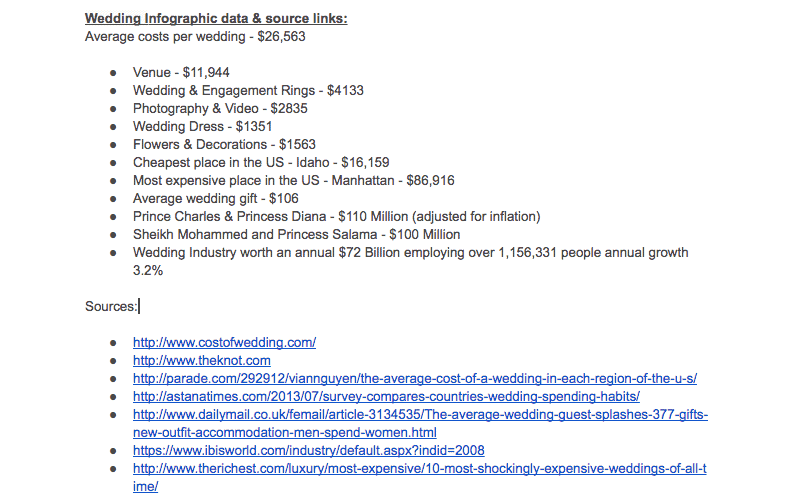
👉 Tip: Remember to add all the relevant source URLs and attributions. These give your link-building infographic more authenticity, and people will like the fact that you’ve researched multiple data sources and websites, which will ultimately help you to build backlinks.
Step 3: Creating the infographic
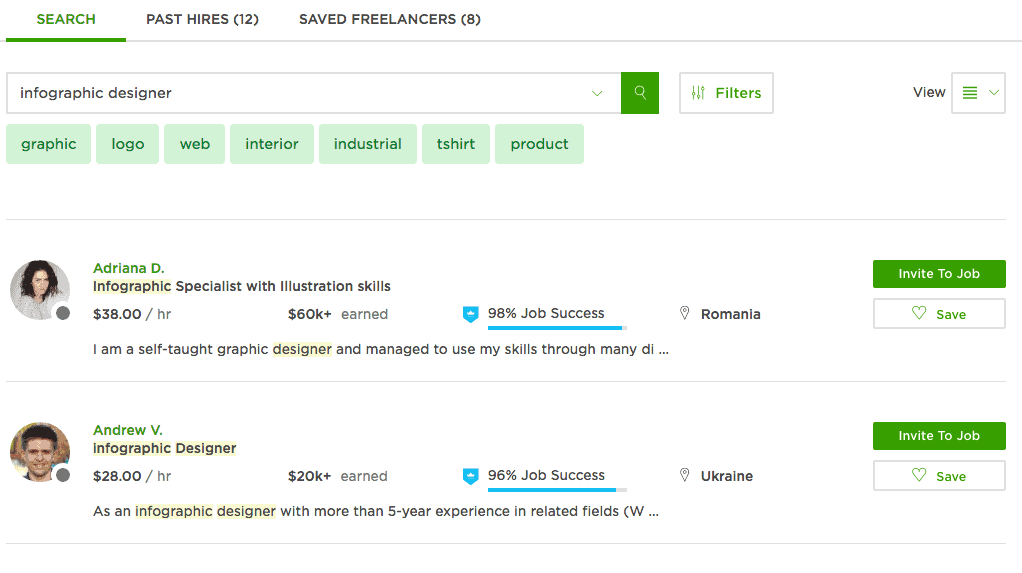
If you don’t work directly with a graphic designer or have one in-house that you can rely on, we recommend reaching out to one on UpWork.
Using this platform, you’ll find third-party services and freelancers available to help you design your infographic.
It’s imperative that you make the project's scope and requirements very clear as the freelancer you hire might not be familiar with your niche or infographic topic. You should also provide them with your list of key data.
Your brief can also include examples of infographic designs that you like. You can show the designer examples from the ones you discovered in your initial research.
It’s important that your design is clean and easy to read, so you’ll want to communicate this with the designer you hire.
Lastly, set up a job on the UpWork platform and invite a couple of designers to apply.
While some fantastic infographic creation services are out there, we prefer using a freelancer from UpWork because it provides increased flexibility and communication.
You also generally get better value for money. Your payment goes into Escrow, and you work on as many iterations as it takes (within reason, of course) until you're happy with the end product.
Now, we have a finished infographic!
Step 4: The outreach process
Once you’ve published the infographic on your website with some quality surrounding text, you need to build a list of outreach targets and get your infographic in front of them to build links.
Here are some simple steps for getting your link-building outreach right.
Use Ahrefs to find link targets
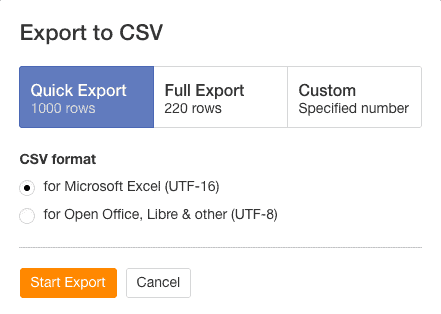
Get your list of ‘successful infographic URLs’ and plug them one by one into the Ahrefs site explorer.
Filter for one link per domain and export the backlink profile to CSV.
After you've downloaded the CSV file, grab both the referring domain URL (home page) and the referring page URL (the exact page that referenced the infographic) so that you can add both of these to our outreach list.
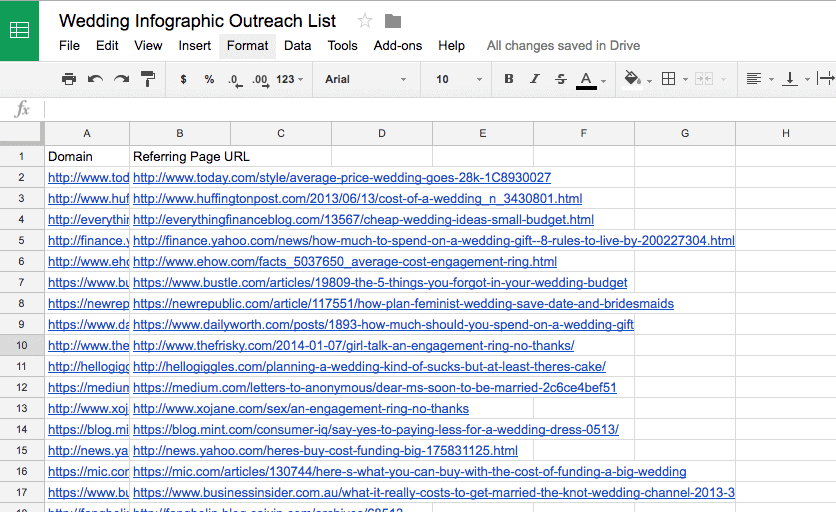
Build an outreach list
Use these links to build your outreach list, which is a list of websites you want to target in your outreach campaign.
It should look something like this:
Use an outreach tool
You’ll now need to upload your complete list to an outreach tool. We use one called Pitchbox.
If you use another outreach tool like Buzzstream or no tools at all, the same process discussed below applies.
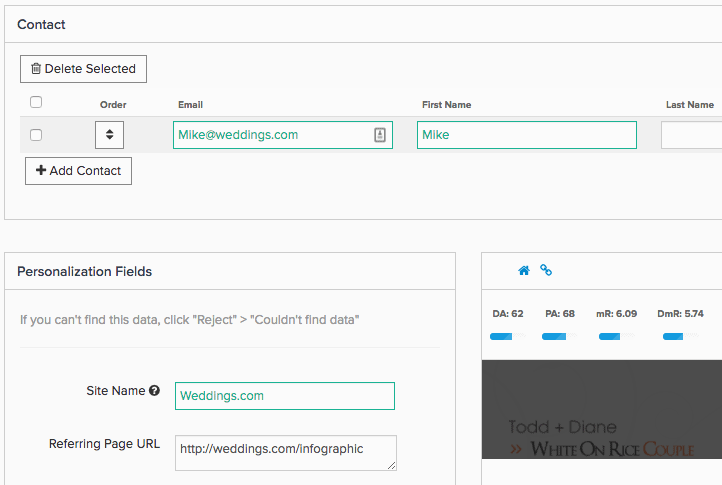
Ensure you have all the personalized data you want to include in your outreach emails so that your templates look great and speak directly to the reader.
Website owners will quickly notice a generic outreach email that’s been copied and pasted over and over again.
This personalized data includes the:
Recipient's email address.
Recipient's first name.
Recipient’s website (not the URL) so we can include it in the subject line.
Here’s what Pitchbox looks like at the personalization stage:
Create an outreach email template
You’re now preparing your pitch to website owners to convince them to link to the amazing infographic you have created.
The best thing to do is create an email template you’ll want to send out with your personalized data.
Here’s a standard template that you can adjust and tweak for your own purposes:
Hi [Name],
My name’s Rebecca, an independent graphics designer hoping to further my career by getting my work published on some important blogs.
I recently created an infographic on the cost of weddings in 2017 - It’s super well researched and I think your readers would enjoy. I noticed you guys had previously published a wedding infographic (REFERRING_PAGE_URL) so thought you might enjoy this too!
You can see a preview here.
I’d be more than happy to write some exclusive text to introduce the graphic to [SITE_NAME] readers.
Please let me know if you’d be interested in sharing with your audience.
Kind Regards,
Rebecca
---
💡 Tips for your Outreach Template

Here are some extra things to remember to perfect your outreach campaign templates:
Provide the website owner with a link to your infographic hosted on Imgur to preview. This gives you a neutral destination to host the infographic. You can upload it to your website CMS if you prefer.
In a follow-up email, you can send the website owner an embed code to let them know that it won’t take much effort for them to link to the infographic and build it into their website. You can use this tool to generate your infographic embed code.
Don’t worry if the target website doesn’t use your embed code. If they simply upload the image directly to their website, you can ask them for a home page citation.
Always send at least one—but preferably two—follow-up emails. Keep these short and ensure that they sound natural. You can include the content from the previous email rather than starting a new thread.
Now that you’ve got your email template ready, it’s time to start sending out those emails and attracting backlinks to your infographic.
Some Insight from the LinkBuilder Team
We have been creating infographics for the purpose of link building for many years for loads of clients.
Here is some of the best advice we can give you regarding link-building with infographics:
You can use standard prospecting methods to find more relevant websites in your niche if you need more outreach opportunities.
It’s important to present original data and insights in your infographics. The more data and information you can provide, the greater the chance that real people will take notice. These days, it takes a lot to impress people.
You need an infographic that offers groundbreaking insights, or that solves a problem, such as an infographic on how to prevent Alzheimer’s through proper nutrition. Come up with fresh ideas and consider what people will feel motivated to link to. Something that solves a problem is always a good start.
Get the infographic in front of as many people as possible, and we promise you will get the links you crave.
Wrapping up on Link-Building Infographics
Infographics are a great way to take your link-building campaigns from average to exceptional.
Other sites will gladly give you a backlink if your content assets are worth sharing.
This is why it’s important that your infographic is of high quality and that your concept is original.
These are the two most critical elements to getting link building with infographics right.
Using infographics to build links is a winning strategy, and we’d love to tell you more about how we use data visualization to help our clients get the links they deserve. Visit our website to find out more.